Site menu:
New: Continuous Norming with R (cNORM)
R package for generating continuous test norms in psychometrics and biometrics and for analyzing the model fit

User Guide for the Norm Scale Calculator
Norms are useful to compare individual scores in a standardized test with the results of a representative population. The transformation of individual results into a normal score is usually based on the assumption of a normal distribution of personal traits or abilities within the reference group (see red line in the charts of the calculator). This means that many people have scores around the arithmetic mean and only few people have scores deviating extremly from the population mean.
A bunch of different scales exist which all aim at expressing the relative extremity of the scores. The Norm Scale Calculator simplifies the conversion between these different scales. You simply have to move the slider with the mouse or to enter the scores in the appropriate text field and press RETURN. The software tool automatically calculates all other scores.
Charts
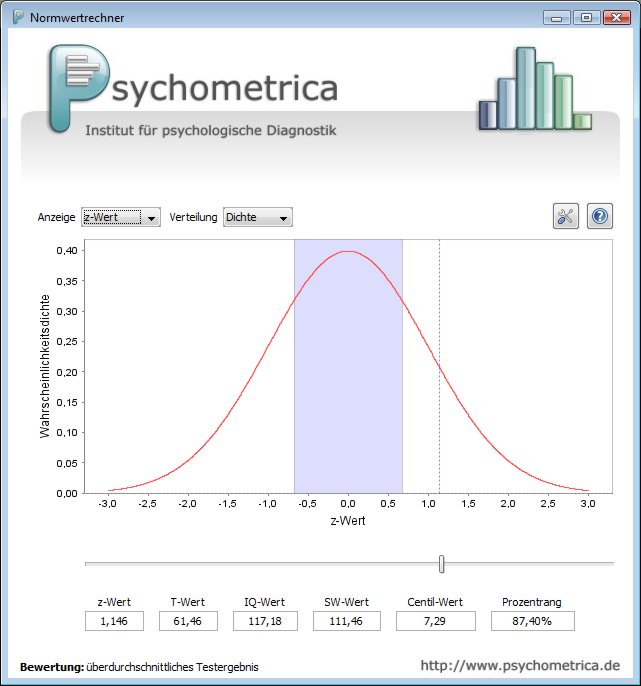
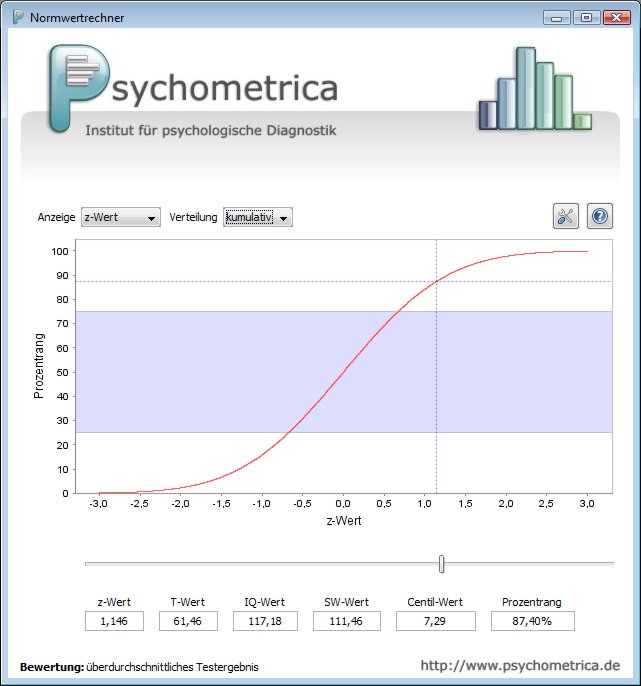
The blue range within the charts highlights the normal range, indicating an avarage result. The dashed lines indicate the relative position of an individual compared to the reference population. There are two different distributions:
- density: The density function of the normal distribution is shown.
- cumulative: The cumulative density funtion is displayed. The y-axis shows the percentiles corresponding to the respective norm scores.
 |
 |
Age Calculation
In order to choose the correct normal score in psychological tests, it is necessary to calculate the exact age. Unfortunately, many errors occur at this stage of the analysis of the test results, potentially leading to drastic misinterpretations. Therefoe, with version 1.8 an age calculation module was introduced in the norm scale calculator. Please click on the calendar icon in the toolbar to start the age calculation.Preferences
There are different conventions about which range is perceived as normal. The program has two different settings that influence the blue range marker and the verbal interpretation below the charts. You can access these settings via the "Tools" button:
- "European Convention": The range between z-score -1 and +1 is set as the normal range. This equals 68% of the population.
- "American convention": The normal range lies between percentile 25 and 75. The normal range therefore covers 50% of the population.
Norm Scales
The following norm scales are available:
| Mean | Standard Deviation | |
| z-Score | 0 | 1 |
| T-Score | 50 | 10 |
| IQ-Score | 100 | 15 |
| SW-Score (= "Standard Value", a scale used in German speaking countries) |
100 | 10 |
| WECHSLER Subscale | 10 | 3 |
Terms of Use
The Norm Scale Calculator may be used free of charge for private usage. The software and any authorized copies that you make are the intellectual property of Psychometrica. You agree to hold Psychometrica harmless from any and all liabilities, losses, actions, damages, or claims (including all reasonable expenses, costs, and attorneys fees) arising out of using the software if they are not deliberately intended or caused by grossly negligent behavior of Psychometrica and its suppliers. We do not grant you the right to sublicense or distribute the software. You may not modify, adapt, translate or create derivative works based upon the software. You will not reverse engineer, decompile, disassemble or otherwise attempt to discover the source code of the software except to the extent you may be expressly permitted to reverse engineer or decompile under applicable law.