Site menu:

Calculation of test quality criteria for screenings
Screening procedures aim at identifying persons who have a certain (binary) characteristic. They are often used to identify people at risk who later develop mental disorders, diseases or school problems. For the evaluation of the screenings there are a number of characteristic values, of which sensitivity and specificity are the best known. They show how many people were correctly identified by the test as risk and how many as non-risk persons.
Besides these basic data, however, there are a number of other important data, such as the positive and negative predictive values or the relative increase in the hit rate compared to the random hit rate (RIOC); further information and a detailed description of the various parameters can be found in Marx & Lenhard, 2010; see also the glossary).
Online calculator to determine specificity, specificity, predictive value and the Relative Improvement Over Chance
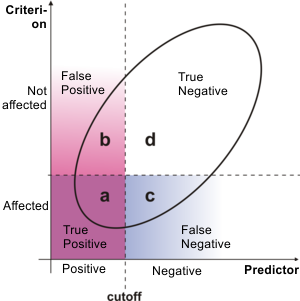
You can use the table to determine various characteristic values for screening procedures. Please enter the absolute case numbers in the table cells.
| Area proportions see graphic please fill in absolute numbers |
Predictor (e. g. from a screening) |
||
| positive result | negative result | ||
| Criteria | not affected | b (false positive) |
d (correct negative) |
| affected | a (correct positive) |
c (false negative) |
|
| Quality indicators of the screening: | |
| Sensitivity or Recall | |
| Specificity | |
| Positive predictive value or Precision | |
| Negative predictive value | |
| Contingency Coefficient rPhi | |
| Hit ratio or Accuracy | |
| Random hit ratio | |
| Relative Improvement Over Chance (RIOC) | |
Concrete test results on the basis of the screening criteria
Ok, let's turn the logic around and look at the numbers of correct positive and false positive diagnoses that result. If the base rate is very low, then screening very quickly reaches its limits and it is then primarily used to pre-select people for further diagnostics. Let us take COVID19 as an example and a fictitious incidence of 100 / 100 000 persons for infections in the last 7 days, which corresponds to a baserate of 0.1%. Good rapid tests have at least a specificity of 99.5% and a sensitivity of 95%. What number of false positive diagnoses results if 1000 people are examined with a rapid test in this infection situation?
| Baserate between 0 and 100 in percent |
Sensitivity between 0 and 100 in percent |
Spezifity between 0 and 100 in percent |
Number of persons |
| Results of the screening: | |
| False Positive | |
| False Negative | |
| Correct Positive | |
| Correct Negative | |
| Share of false positives in all positive results (in percent) | |
| Share of false-negative results in all negative results (percent) | |
Glossary:
- Sensitivity or Recall: The sensitivity indicates the proportion of affected persons correctly identified as affected by the screening. It is the share of true positive outcomes among all affected persons (true positive and false negative). In machine learning, this as well known als recall.
- Specificity: The specificity indicates the proportion of individuals not affected who were classified as not affected by the test.
- Positive predictive value or Precision: If a person receives a positive result, the positive predictive value can be used to determine the probability of actually being affected. It is the share of true positive outcomes among all positive results (true positive and false positive). In machine learning, this is as well called precision.
- Negative predictive value: Once a screening has been carried out and a negative result is obtained, a residual risk usually remains. The negative predictive value indicates the probability of not actually being affected by a negative value.
- Contingency Coefficient: Measures the degree of association of dochotomous variables.
- Hit ratio or Accuracy: This specification indicates the proportion of correct classifications by a test procedure.
- Random hit ratio: If the frequency of occurrence of a phenomenon in a society is taken as a basis and this proportion of persons is randomly taken into account, there is a certain probability of correctly identifying individual persons affected. This proportion is the chance hit rate.
- RIOC (Relative Improvement Over Chance): The RIOC index indicates how much the hit rate increases compared to the random hit rate due to a test procedure.
Online tool as Excel table and Java source code
The online tool is available as an Excel sheet and as Source-Code in Java under the General Public License (GPL):
- Excel Sheet: Please enter the number of false and correct positive and negative test results in the empty, colored cells for the calculation of test characteristics. The corresponding values are calculated automatically.
- Download of the Source-Code: The program code determines the same information as the Excel table and can be used for program-based calculation of these characteristic values. Please note the comments and notes on use in the source code.
Literature
Marx, P. & Lenhard, W. (2010). Diagnostische Merkmale von Screeningverfahren. In M. Hasselhorn & W. Schneider (Hrsg.), Frühprognose schulischer Kompetenzen. Göttingen: Hogrefe.Citeable: Lenhard, W. & Lenhard, A. (2014). Calculation of test quality criteria for screenings. available: http://www.psychometrica.de/testkennwerte.html. Psychometrica.