Site menu:

cNORM - Troubleshooting and Frequently Asked Questions
cNORM works "out of the box" in many scenarios, especially with a sufficiently large amount of data and a sufficiently large share of variance explained by the explanatory variables (e.g. a strong age trend). However, there are also cases that are more difficult to handle. In any case, we recommend checking the plausibility of the generated solutions and adjusting the parameters "manually" if necessary. Similar to factor analyses, model selection is a multi-stage process in which different models usually have to be calculated and compared with regard to different quality criteria. In the case of cNorm, there are three main quality criteria, namely the explained variance, the simplicity of the model and the model plausibility or consistency. As a rule, the latter must be taken into account especially at the extreme ends of the model.
In a nutshell:
- A power parameter of k = 4 is sufficient for almost all scenarios.
- Models with a small number of terms (e.g. 'terms = 4' to 'terms = 10' in 'bestModel') are the most robust and usually produce the best results in cross-validation. Avoid models with a lot of terms and rather accept a slightly lower R2 instead.
- After an initial model calculation, inspect the information functions of the models ('plotSubset') and the percentile lines ('plotPercentiles' and 'plotPercentileSeries'). In a second step, calculate the model again using those parameters (e.g. a certain number of terms at given k) that you have previously determined to be optimal.
- For a data set with many finely graded age groups with small samples, it may be more convenient to combine the age groups into broader intervals.
1. Intersecting percentile curves
During modeling, inconsistent models may occur, especially in extreme areas, with strong floor or ceiling effects or in the event of over-adjustment. These are expressed, for example, by the fact that the lines of the percentiles overlap ('plotPercentiles') or that a corresponding warning is issued in the modeling ('checkConsistency').
Possible solutions:
- Please vary the number of terms of the model (parameter 'terms' in function 'bestModel').
- Use cross-validation ('cnorm.cv') and plotSubset to determine a meaningful number of parameters that can then be used in the model.
- Reduce the number of terms. Simpler models lead to smoother lines. Avoid wavy lines, as this indicates over-fitting.
- Use the function 'plotPercentileSeries' to plot a series of models. Use the 'end' parameter to specify the maximum number of terms.
- Note that in principle each model has only one finite range within which it produces consistent results. So consider which norm value range you want to cover at all.
- Consider whether your test is suitable at all to cover this range, or where ceiling or floor effects might be used. Note that standard values should only be reported for the consistent model areas. Inconsistent edge areas may have to be simply cut off.
# Creating a percentile plot
plotPercentiles(data, model) # Display the current model
plotPercentileSeries(data, model) # Display a sequence of models
2. How to deal with covariates
The question of whether separate norms should be generated for different groups of people in a population (e.g. men versus women, people with high versus low education ...) goes beyond the mere statistical modeling of the data. Please consider whether such a distinction makes sense for your scenario or not.
Possible solutions:
- Stratify the sample before modeling using all relevant variables. Most often, the best way is to divide the sample into sub-samples and model them separately.
- CAUTION! EXPERIMENTAL! Since version 1.2.0 it is possible to model a binary covariate. Currently, we cannot yet evaluate whether our algorithms generally provide good solutions for this. If you include the covariates, they must be included in the data preparation and later specified when generating the norm scores. Feedback about the performance of our approach is always welcome.
# Include a covariate, e. g. based on the integrated PPVT4 dataset
# with sex as the covariate (1 = boys, 2 = girls)data1 <- rankByGroup(PPVT, group="group", raw="raw", covariate="sex")
data1 <- computePowers(data1)
model <- bestModel(data1)
plotPercentile(data1, model, covariate = 1) # Specify the degree of the covariate# Often, covariates are excluded in the modeling, since there impact is
# much smaller than that of the explanatory variable. Force the covariate
# and all interactions to be included in the model (though might results in
# unstable models):model <- bestModel(data1, force.in = c("COV", "L1COV", "A1COV", "L1A1COV"))
# Based on your theoretically motivated expectations of the influence
# of the covariate, you might want to include a specific covariate term,
# for example a linear term and the three-way interaction:model <- bestModel(data1, force.in = c("COV", "L1A1COV"))
# Too plot these models side by side:
c(plotPercentiles(data1, model, covariate = 1),
plotPercentiles(data1, model, covariate = 2))
3. Necessary sample size for the modeling
Our simulations indicate that a group size of 50 cases per age group or even less can produce very reliable models (see figure). More important than a particularly large number of cases is that the total sample is as representative as possible. (Please note that random samples do not become automatically more representative as the number of cases increases.) However, if the sample size is too small, not only will the power of the statistical methods decrease, but it will also be difficult to stratify the sample with regard to all relevant characteristics. In addition, the number of age groups and the strength of the explanatory variables also play a role.
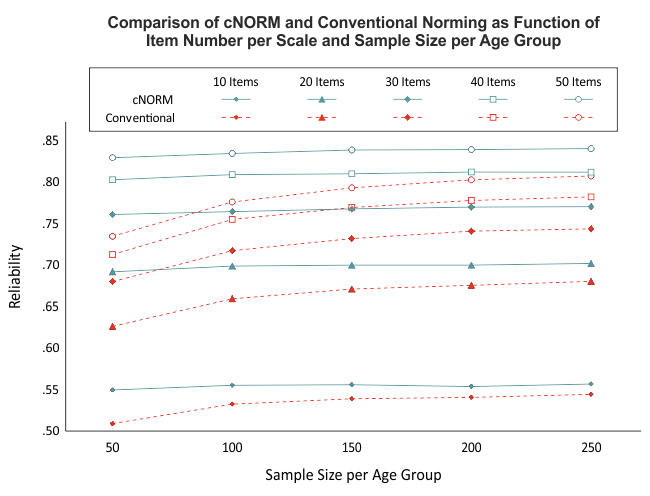
cNORM is able to partially compensate for violations of representativity or lower case numbers in specific age groups, since the models are calculated on the basis of the entire data set. Nevertheless, a very high-quality data basis should be ensured when standardizing a test procedure.
Possible solutions:
- If you have few cases in the individual age groups, it is better to combine the data into larger age groups. For example, despite a wider age range, use four groups with a sufficient number of cases rather than eight groups with only a small number of cases. The mean values of the age groups do not necessarily have to be equal.
4. Low share of variance explained by the explanatory variable
Since version 1.1.8 cNORM automatically checks the share of explained variance by the explanatory variable in the data preparation (functions 'prepareData' and 'computePowers') by means of a polynomial regression (up to the power parameter k). Thus, not only linear, but also more complex relations are captured, usually up to the fourth power (basic setting). If there is only a small correlation between the explanatory variable and the raw scores, cNORM issues a warning message. In this case, the question arises whether the inclusion of explanatory variables in the calculation of standard scores really makes sense or whether, for example, a single norm score table is sufficient. With a low share of variance explained by the explanatory variables, it can sometimes happen that the models are not very stable and that the default settings for the model estimation of R2 = .99 is not reached.
Possible solutions:
- Do not include the explanatory variable: Set the parameter 'group = FALSE' in 'prepareData' or 'rankByGroup'. The data will then be converted directly into norm scores. To create norm tables, you can still continue as normal, create a model and generate the tables.
- Avoid models with the maximum number of predictors. In the 'bestModel' function, enter fixed values for R2 or the number of terms. You can determine a suitable number of terms using the 'plotSubset' function. Search for the bend in the curve, as with a screen plot, where a further addition of predictors no longer leads to a great improvement in the model fit. Alternatively, you can use the cross-validation function 'cnorm.cv'. In any case, it makes sense to visually inspect the model fit using 'plotPercentiles' or 'plotPercentileSeries'.
5. Strongly meandering percentile lines in the 'plotPercentiles' function
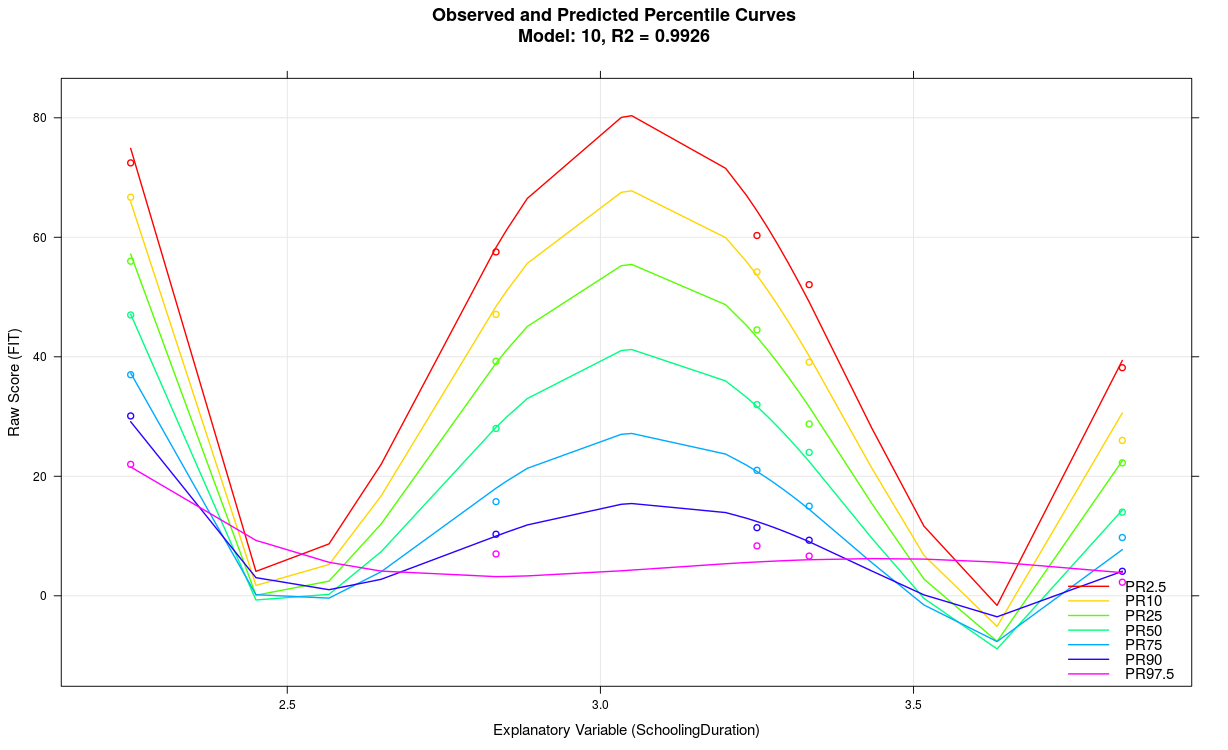
The model probably shows an overfit, e.g. because the share of variance explained by the explanatory variable is not very high, too many predictors were used, the scale generally does not measure reliably, there are strong violations of representativeness in individual norm groups, etc... In many cases, it is simply due to small sample sizes, resulting in an overfit of the model - as it is the case in the model above with n ≤ 50 per subgroup. It might as well be that the cNORM package is not suitable to model the specific dataset. Please note the suggested solutions of the previous point. In most cases it is recommended to use a simpler structured model with fewer terms.
Possible solutions:
- Reduce the k-parameter to 3 or even 2.
- Reduce the number of terms.
- Check your data: Do you have sufficient sample sizes? Is there a clear trend of the explanatory variable?
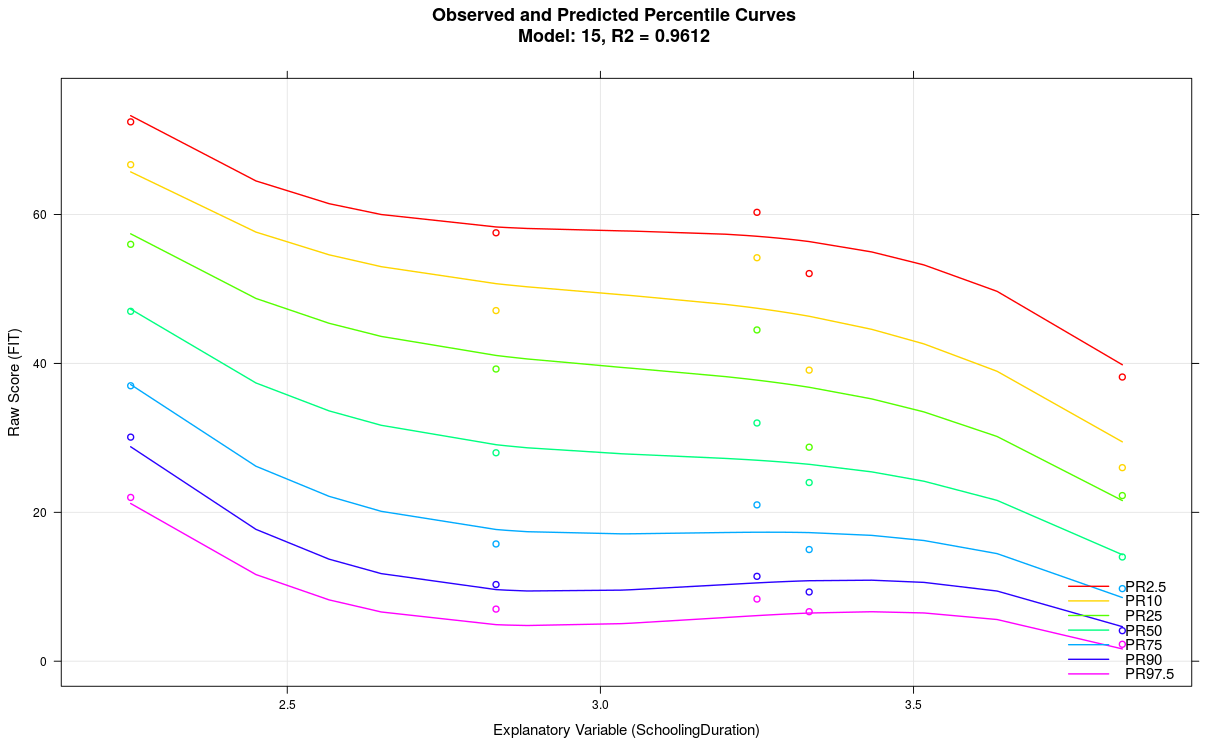
Reduction of k to 3 in the example above results in the following model:
6. Modeling the continuous age variable does not work
If you use the function 'prepareData' for data preparation and specify a grouping variable, a continuous age variable and the width of the age interval (parameter 'width'), the ranking is carried out using a sliding window. You can as well use the function 'rankBySlidingWindow' and then 'computePowers' instead. However, for the modeling to work, the values of the grouping variable must correspond to the age variable. This means: The values of the grouping variables should reflect the mean age of the respective age group.
Possible solutions:
- Check the mean age of the age groups. Does the mean age in the data correspond to each person's age group, he or she belongs to?
- The 'rankBySlidingWindow' function creates a corresponding grouping variable if you specify the number of groups using the 'nGroups' parameter. This already correctly specifies the average age in the respective groups.
# Generation of a consistent grouping variable with
# 4 groups on the basis of the age variabledata1 <- rankBySlidingWindow(data, age=data$age, width = 1, nGroups = 4)
7. Is it possible to apply weights to the cases in the norming sample?
Both in the ranking and in the model calculation with 'bestModel' a weighting of the cases can be done with the parameter 'weights'. With computeWeights(), cNORM contains a specifically designed function for the post-stratification of the data on the basis of raking. This can reduce the effect of unbalanced norm samples. Please refer to the vignette "Weighted regression".
 |
Jamovi |
Overview |
 |